Projection
This section describes the “Projection” controls for plotting.
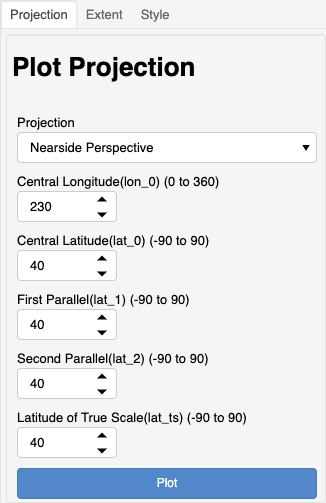
The grid generation application supports the following projections for plotting of the model grid and other information:
Nearside Perspective
Mercator
Lambert Conformal Conic
Stereographic
Please see Cartopy projection list for more details on these projections.
The gridtools library attempts to conform to Proj terminology for setting projection parameters such as latitude of true scale.
Here is a comparison of Cartopy mapping parameters to parameters for use with Proj and Gridtools:
Cartopy
Proj
Gridtools
central_latitude
lat_0
lat_0
central_longitude
lon_0
lon_0
false_easting
x_0
x_0
false_northing
y_0
y_0
standard_parallels
lat_1, lat_2
lat_1, lat_2
latitude_true_scale
lat_ts
lat_ts
scale_factor
k_0
k_0
satellite_height
h
satelliteHeight
A “Plot” button is provided on each control to update the plot to the right after making any adjustment.
See also: setPlotParameters().