Style
This section describes the “Style” controls for plotting.
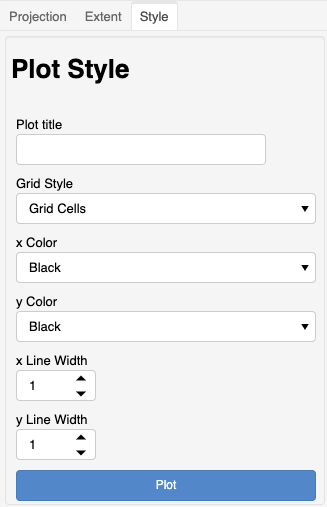
The style controls allow for customization of the plots.
Plot Title
A default title is always generated for every plot. A custom plot title may be provided to replace the default title.
Grid Style
One of three styles may be selected.
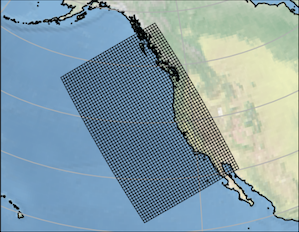
Grid Cells
This is the default style for plotting the model grid. This will show the nominal grid cells for the model grid.
Supergrid Cells
This option will instruct the plot to show the denser supergrid for the model grid. This options supports MOM6 model grids.
Line Width
These controls adjust the width of x and y lines drawn for the extent or grid cells. The line width can be changed from the default of one (1) dpi.
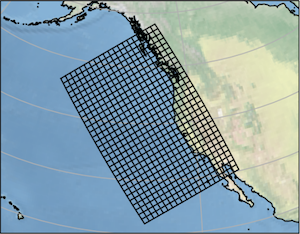
Note
For denser grids, it may be useful
to change the length of the x and
y line width to 0.5 or even
0.1 dpi.
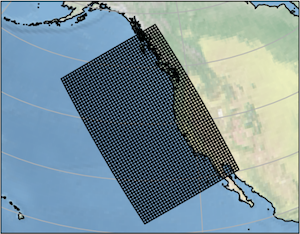
Below is an example plot with
x and y line width set to 0.5.